Support and Resistance in Trading: Foundations of Technical Analysis
Support resistence
Support and resistance are among the most fundamental and widely used concepts in technical analysis. They form the backbone of price action trading and help traders identify potential entry and exit points in financial markets such as stocks, forex, commodities, and cryptocurrencies. Whether in short-term intraday trading or long-term investing, understanding support and resistance levels allows traders to make more informed decisions based on market psychology and price behavior.
At its core, support and resistance represent price levels where supply and demand dynamics tend to shift, causing price reversals or pauses. These levels are not fixed lines but zones where market participants repeatedly react. By analyzing these zones, traders attempt to anticipate future price movements with greater probability.
What is Support?
Support is a price level where a downtrend is expected to pause due to a concentration of demand. In simpler terms, it is a level where buyers are more willing to enter the market, preventing the price from falling further. When price approaches a support level, buying interest typically increases, leading to either a temporary bounce or a trend reversal.
For example, if a stock repeatedly falls to ₹500 and then rises, ₹500 becomes a strong support level. Traders recognize that buyers step in at this level, making it a potential buying opportunity. The more times a price touches and bounces from a support level without breaking it, the stronger that level is considered.
Support exists because of market psychology. Traders who previously bought at that level may want to buy again, believing it represents good value. Others who missed buying earlier may place buy orders there. Additionally, traders who sold at higher levels may close their short positions at support, adding further buying pressure.
What is Resistance?
Resistance is the opposite of support. It is a price level where an uptrend is expected to pause due to increased selling pressure. At resistance, supply exceeds demand, preventing the price from rising further.
If a stock repeatedly rises to ₹700 and then falls, ₹700 becomes a resistance level. Sellers dominate at this price, either booking profits or initiating short positions. Like support, resistance becomes stronger when price tests it multiple times without breaking through.
Resistance also reflects psychological behavior. Investors who bought near the resistance level and experienced losses may sell when the price returns to that level to break even. Meanwhile, short sellers may view resistance as a favorable entry point.
How Support and Resistance Are Formed
Support and resistance levels are formed by historical price action. Markets move based on supply and demand, and past price reactions often influence future decisions. Some key ways these levels are formed include:
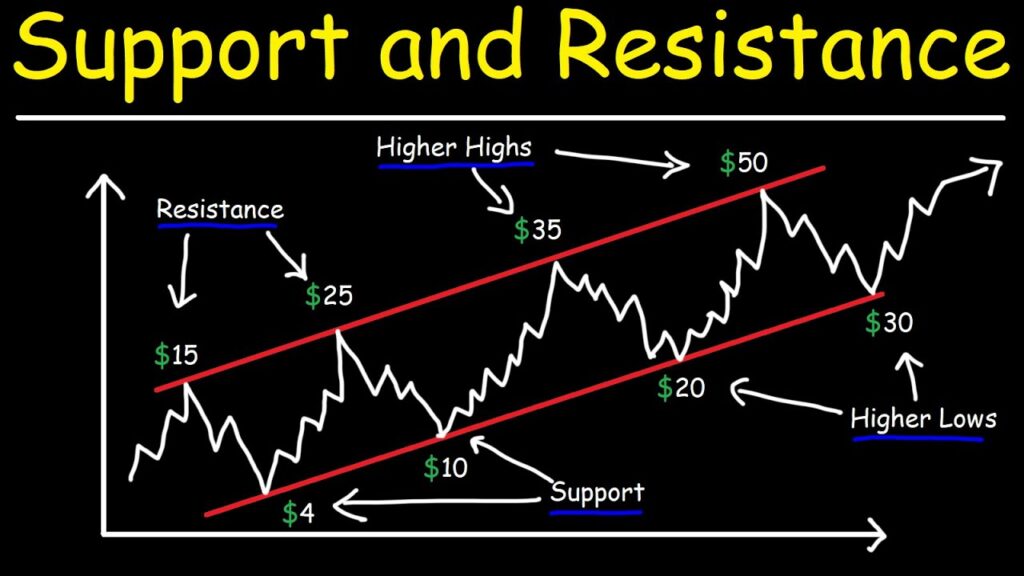
- Previous Highs and Lows: Swing highs often act as resistance, and swing lows act as support.
- Round Numbers: Psychological levels such as 100, 500, or 1000 often serve as support or resistance because traders naturally focus on round figures.
- Moving Averages: Common moving averages like the 50-day or 200-day moving average can act as dynamic support or resistance.
- Trendlines: Uptrend lines act as support, while downtrend lines act as resistance.
- Fibonacci Levels: Traders use Fibonacci retracement levels to identify potential support and resistance zones.
These levels are not exact points but areas. Price may briefly cross them before reversing, a phenomenon known as a false breakout or fakeout.
Role Reversal: Support Becomes Resistance
One of the most powerful principles in trading is role reversal. When a support level is broken decisively, it often becomes resistance. Similarly, when resistance is broken, it tends to become support.
For instance, if a stock breaks above ₹700 (previous resistance), traders who previously sold at that level may now buy if the price retests ₹700 from above. This shift occurs because market sentiment changes—what was once considered expensive may now be viewed as a new base for higher prices.
Role reversal provides excellent trading opportunities, especially during breakouts and pullbacks.
Breakouts and Breakdowns
A breakout occurs when price moves above resistance with strong volume, indicating increased buying interest. A breakdown occurs when price falls below support with significant selling pressure.
Breakouts can signal the beginning of a new trend. However, not all breakouts succeed. False breakouts occur when price briefly moves beyond a level but quickly reverses. Traders often wait for confirmation, such as high trading volume or a strong closing price, before entering trades.
Volume plays a crucial role in validating breakouts. High volume suggests strong conviction among market participants, increasing the likelihood of a sustained move.
Trading Strategies Using Support and Resistance
Traders use support and resistance in multiple ways:
- Buying at Support and Selling at Resistance: In range-bound markets, traders buy near support and sell near resistance, aiming to profit from repeated price oscillations.
- Breakout Trading: Traders enter trades when price breaks above resistance or below support, anticipating a strong directional move.
- Stop-Loss Placement: Support and resistance levels help traders determine logical stop-loss points. For example, a trader buying at support may place a stop-loss slightly below it.
- Target Setting: Resistance levels often serve as profit targets for long trades, while support levels serve as targets for short trades.
Successful traders combine support and resistance with other indicators such as RSI, MACD, or candlestick patterns to increase probability.
Importance of Timeframes
Support and resistance levels vary depending on the timeframe. A level on a daily chart is generally stronger than one on a five-minute chart. Long-term investors focus on weekly and monthly levels, while intraday traders rely on shorter timeframes.
Higher timeframe levels often carry more weight because they reflect broader market participation. Many professional traders align trades with major support and resistance zones from higher timeframes.
Limitations and Risks
Although support and resistance are powerful tools, they are not foolproof. Markets are influenced by news events, economic data, and unexpected developments that can break even the strongest levels. Relying solely on support and resistance without proper risk management can lead to losses.
Additionally, drawing levels can be subjective. Different traders may identify slightly different zones. Therefore, flexibility and risk control are essential.
Psychological Significance
Support and resistance work largely because of collective human behavior. Financial markets reflect fear, greed, hope, and regret. These emotions create patterns that repeat over time. When many traders recognize the same levels, their collective actions reinforce those levels.
This self-fulfilling nature makes support and resistance effective. However, when sentiment shifts dramatically, levels can fail quickly.
Conclusion
Support and resistance are fundamental concepts that provide structure to price charts. They help traders understand market psychology, identify potential turning points, and manage risk effectively. Whether trading stocks, forex, or commodities, mastering these concepts enhances decision-making and strategic planning.
While not guaranteeing success, support and resistance offer a framework for analyzing price behavior. When combined with discipline, risk management, and other technical tools, they become powerful components of a trader’s toolkit. Ultimately, understanding support and resistance is essential for anyone seeking consistent performance in financial markets.