Trend in the Stock Market: Understanding Market Direction and Momentum
The concept of trend is one of the most fundamental principles in the stock market. A trend represents the general direction in which the price of a stock or the overall market is moving over a period of time. Traders and investors rely heavily on identifying trends to make informed decisions, as the famous saying in trading goes, “The trend is your friend.” Understanding trends helps market participants align their strategies with prevailing price movements rather than trading against the dominant direction.
In simple terms, a trend occurs when prices consistently move in one direction—either upward, downward, or sideways. Recognizing and interpreting trends correctly can significantly improve the probability of successful trades and investments.
Types of Trends in the Stock Market
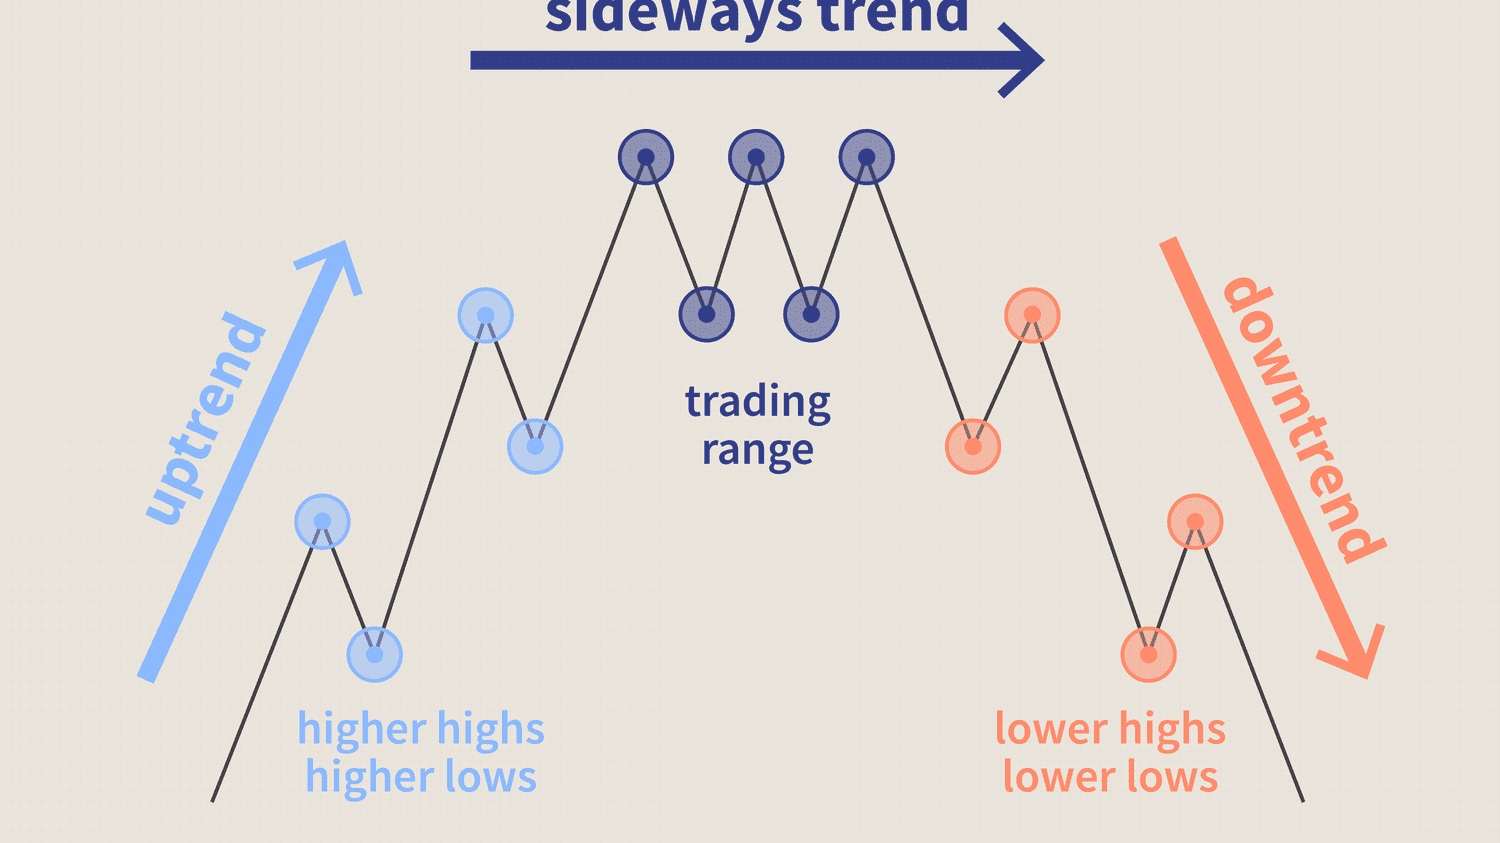
There are three primary types of trends in the stock market: uptrend, downtrend, and sideways (or range-bound) trend.
1. Uptrend
An uptrend occurs when the price of a stock or market index forms a pattern of higher highs and higher lows. This means that each peak is higher than the previous one, and each pullback does not fall below the previous low. An uptrend reflects strong buying interest and positive investor sentiment.
During an uptrend, investors are optimistic about economic conditions, company performance, or broader market growth. Long-term investors prefer to buy during pullbacks in an uptrend, believing the overall direction will continue upward.
2. Downtrend
A downtrend is characterized by lower highs and lower lows. In this scenario, each rally fails to exceed the previous high, and each decline falls below the prior low. A downtrend signals selling pressure and negative market sentiment.
Downtrends may occur due to poor company earnings, economic slowdown, geopolitical tensions, or broader market corrections. In such conditions, traders may look for short-selling opportunities or avoid buying until signs of reversal appear.
3. Sideways Trend (Range-Bound Market)
In a sideways trend, the price moves within a defined range without forming clear higher highs or lower lows. The market lacks strong direction and oscillates between support and resistance levels.
Range-bound markets often reflect uncertainty among investors. Traders typically buy near support and sell near resistance in such conditions, rather than following trend-based strategies.
Timeframes of Trends
Trends exist across multiple timeframes: short-term, intermediate-term, and long-term.
- Short-term trends may last from a few days to weeks and are commonly analyzed by swing traders and intraday traders.
- Intermediate-term trends can last several weeks to months.
- Long-term trends may extend for years and are typically followed by long-term investors and institutions.
For example, a stock may be in a long-term uptrend while experiencing short-term pullbacks. Understanding the relationship between different timeframes helps traders avoid confusion and align their strategies appropriately.
How to Identify Trends
Identifying trends involves analyzing price action and using technical tools. Some of the most common methods include:
1. Price Structure
The simplest way to identify a trend is by observing price structure—higher highs and higher lows indicate an uptrend, while lower highs and lower lows indicate a downtrend.
2. Trendlines
Trendlines are drawn by connecting significant lows in an uptrend or significant highs in a downtrend. These lines act as visual guides to identify direction and potential reversal points.
3. Moving Averages
Moving averages are widely used indicators in trend analysis. A stock trading above its 50-day or 200-day moving average is often considered to be in an uptrend. Conversely, trading below these averages may indicate a downtrend.
When shorter-term moving averages cross above longer-term moving averages, it signals bullish momentum (known as a golden cross). When they cross below, it signals bearish momentum (known as a death cross).
4. Volume Analysis
Volume confirms trends. In an uptrend, rising prices accompanied by increasing volume indicate strong buying interest. In a downtrend, falling prices with high volume suggest strong selling pressure.
Importance of Trends in Trading and Investing
Understanding trends is crucial because it improves probability. Trading in the direction of the trend increases the chances of success. Buying in an uptrend aligns with market momentum, while selling or shorting in a downtrend aligns with prevailing weakness.
For long-term investors, identifying a major upward trend early can lead to substantial wealth creation. Many successful investors focus on companies that demonstrate strong growth trends over time.
Trends also help with risk management. In an uptrend, traders may place stop-loss orders below recent swing lows. In a downtrend, stop-loss orders may be placed above recent swing highs.
Trend Reversals and Corrections
Trends do not last forever. Eventually, every trend experiences either a correction or a reversal.
A correction is a temporary counter-movement against the main trend. For example, in a strong uptrend, prices may temporarily decline before resuming upward movement.
A reversal, on the other hand, indicates a complete change in direction. An uptrend turning into a downtrend is a major reversal.
Identifying reversals can be challenging. Technical indicators like RSI divergence, MACD crossovers, and candlestick patterns (such as head and shoulders or double tops/bottoms) may signal potential reversals. However, false signals are common, making confirmation essential.
Psychological Aspect of Trends
Trends reflect collective market psychology. An uptrend represents optimism and confidence, while a downtrend reflects fear and pessimism. Human emotions such as greed and fear drive buying and selling decisions.
In the early stage of an uptrend, only a few investors recognize the opportunity. As the trend strengthens, more participants join, pushing prices higher. Eventually, excessive optimism may lead to overvaluation, increasing the risk of reversal.
Similarly, in a downtrend, panic selling may exaggerate price declines before stabilization occurs.
Understanding crowd behavior helps traders avoid emotional decisions and stay disciplined.
Common Mistakes in Trend Trading
Many traders make the mistake of trying to predict tops and bottoms instead of following the trend. Attempting to trade against a strong trend can result in repeated losses.
Another mistake is entering too late when the trend is already exhausted. Proper analysis and risk management are essential to avoid such pitfalls.
Additionally, ignoring broader market trends can lead to poor decisions. For example, buying a stock aggressively during a major market downturn increases risk.
Conclusion
Trends are the foundation of stock market analysis. They represent the overall direction of price movement and provide valuable insight into market momentum and sentiment. By identifying uptrends, downtrends, and sideways markets, traders and investors can align their strategies with prevailing conditions.
Although trends offer opportunities for profit, they also require discipline, patience, and effective risk management. Recognizing that trends eventually change helps traders remain cautious and adaptable.
Ultimately, mastering trend analysis allows market participants to make informed decisions, minimize risk, and increase the probability of long-term success in the stock market.